Introduction
Methicillin resistant Staphylococcus aureus (MRSA) is one of the leading pathogen of hospital and community-acquired infections, and has the potential to spread easily in healthcare settings and cause frequent outbreaks.1 High rates of infection and colonization with MRSA in healthcare settings have been attributed to increasing antibiotic pressure and poor infection control practices. There is also an increasing trend of community-acquired MRSA infection associated with underlying morbidities.2, 3
The treatment of choice for serious MRSA infections is limited to vancomycin and linezolid; However, clindamycin and macrolides are preferred options for non-serious infections. Worldwide emergence of MRSA has led to the overuse of glycopeptide antibiotics which has led to the emergence of reduced susceptibility to vancomycin among MRSA isolates, leading to therapeutic failure.4, 5
An effective therapeutic option for the treatment of MRSA infections is linezolid belonging to the oxazolidinone class, which is bactericidal and acts by inhibiting protein synthesis by preventing the formation of the functional 70S initiation complex, required for the bacterial translation process.6
It is postulated that the shift in vancomycin MIC (minimum inhibitory concentration) values may be associated with a concurrent rise in MIC values of other anti-MRSA agents.5 In the ICMR Antimicrobial Resistance (AMR) surveillance network scoping report, linezolid-resistant MRSA was reported as 0.6%, out of 42.6% MRSA isolates.7 It has been documented that the oxacillin MIC increased when the MRSA isolates were exposed to fluoroquinolones. Fluoroquinolone exposure influences oxacillin resistance by selective inhibition of a more susceptible subpopulation in heteroresistant S. aureus, which may in turn lead to therapeutic failure.8
Limited data are available on the correlation between linezolid MIC values and the MIC values of other antibacterial agents for MRSA isolates. This study has been conducted to explore the correlation if any, of MIC of oxacillin to the MIC of linezolid in clinically significant isolates of MRSA in a tertiary care hospital.
Materials and Methods
A correlational study was carried out between May and July of 2019 in a tertiary care center, after the protocol was reviewed by Institute Ethics Committee (IEC No. RC/2019/07). The sample size was calculated by assuming a correlation coefficient of 0.5 and a power of 80% with an error of 5; the sample size was calculated as 75.9 Seventy-five archived clinically significant MRSA isolates were included in the study. Repeat isolates from the same patients were excluded from the study.
MRSA screening and Linezolid disk diffusion testing of the archived isolates
All 75 archived MRSA isolates were retested for methicillin resistance using cefoxitin disc (30µg) and oxacillin screen agar. The isolates were also subjected to linezolid antibiotic disk (30µg) susceptibility testing as per the Clinical and Laboratory Standards Institute (CLSI) 2019 guidelines. Zone size of ≥21mm was recorded as sensitive and ≤20mm as resistant for all the MRSA isolates.10
Procedure for preparation of required dilutions of oxacillin and Linezolid for MIC testing
Minimum inhibitory concentration to oxacillin and linezolid was performed by the agar dilution using CLSI standard method.10 Serial dilutions of oxacillin was prepared by using oxacillin sodium salt monohydrate powder from HiMedia Laboratories Pvt. Ltd. using normal saline. The various oxacillin concentrations used for MIC testing were 2µg/mL, 4µg/mL, 8µg/mL, 16µg/mL and 32µg/mL. For recording of the results, the following oxacillin MIC breakpoints were used: Oxacillin MIC- ≤2µg/mL (sensitive) and ≥4µg/mL (resistant). Linezolid agar dilution was performed using Linezolid infusion solution, available at concentration of 2mg/mL. Serial dilutions of linezolid solution were prepared using normal saline, and were incorporated in to MHA plates for further MIC testing. The various concentrations of linezolid used were 0.25µg/mL, 0.5µg/mL, 1µg/mL, 2µg/mL, 4µg/mL, and 8µg/mL. For recording of the results, the following MIC cut offs were used: Linezolid MIC ≤4 µg/mL (sensitive) and ≥8 µg/mL (resistant), as per CLSI 2019 standard guidelines.10
Procedure of agar dilution testing (both Oxacillin and Linezolid) and interpretation of results
The archived isolates of MRSA were grown overnight to check for purity in freshly prepared sheep blood agar. From the overnight growth, 4-5 isolated colonies were inoculated into peptone water broth and turbidity of the broth was adjusted to 0.5 McFarland’s standard using a Wickerham card. The broth was then spot inoculated onto the MHA plates with either oxacillin and linezolid in various prepared concentrations using a standard inoculation loop and plates were incubated at 350C for 24 hours. MICs were determined by looking at the colonies on the spots. More than one colony or thin film of growth was recorded as growth present and previous dilution was recorded as MIC value.10 In addition MIC50 and MIC90 were determined for all 75 MRSA isolates.11 The MIC50 and MIC90 values represented the MIC values at which 50% and 90% of the MRSA isolates were inhibited respectively. All readings were documented in an Excel spread sheet along with the demographic details of the patients from whom the MRSA had been isolated. Clinical diagnosis and outcome were also recorded.
Methods of statistical analysis
The results were presented in terms of frequencies, and percentages. Statistical analysis was done by using Microsoft Excel 2016. A scatter diagram was plotted for both oxacillin and linezolid MIC readings among 75 MRSA isolates. Correlation between oxacillin MIC and linezolid MIC was estimated using the Pearson correlation coefficient, r. It can range between values from +1 to -1. A value of 0 indicates that there is no association between the two variables. A value greater than 0 indicates a positive association; Correlation coefficient between 0.5 and 0.7 indicate moderate correlation; 0.3 and 0.5 indicates low correlation.12
Results
Of the 75 patients from whom MRSA had been isolated, 46 patients (61%) were males and 29 (39%) were females. The majority of them 31 patients (41%) belonged to age group of 41-60 years, followed by 24 (32%) patients of 19-40 years. About 30 (40%) were clinically diagnosed to have skin and soft tissue infection, 20 (27%) had foot ulcer, 12 (16%) had sepsis, 8 (10%) were diagnosed as osteoarthritis and 5 (7%) had chronic suppurative otitis media.
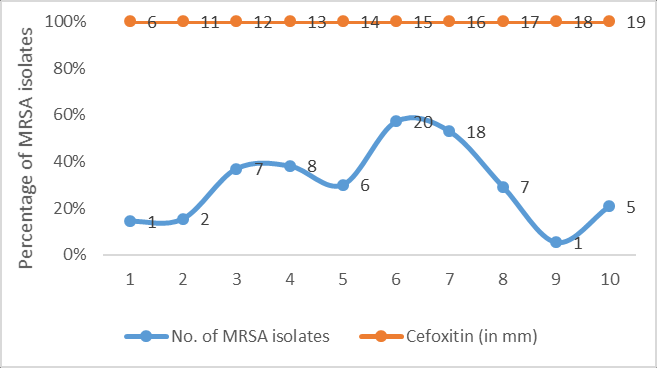
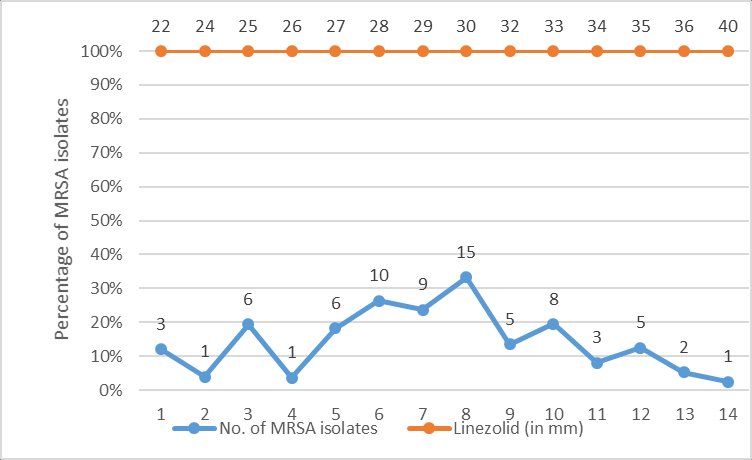
The distribution of zones of inhibition of cefoxitin and linezolid (in mm) among 75 MRSA isolates have been depicted in Figure 1, Figure 2 respectively.
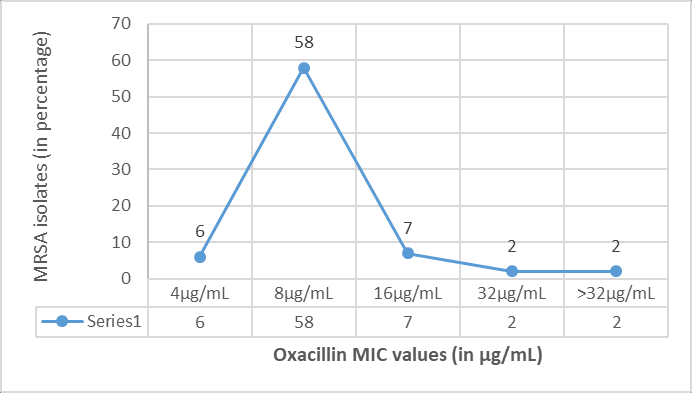
MIC values for oxacillin by agar dilution method (Figure 3), ranged from 4 μg/mL to >32μg/mL among 75 MRSA isolates. 58 (77.3%) isolates had MIC of 8μg/mL, 7 (9.3%) had MIC of 16 μg/mL, 6 (8%) had MIC of 4 μg/mL, 2 (2.7%) isolates each had MIC of 32μg/mL and >32μg/mL. Testing of oxacillin MIC for 15 MRSA isolates at oxacillin concentration of 4 µg/mL has been shown in Figure 4.
Figure 4
Testing of oxacillin MIC for 15 MRSA isolates at a concentration of 4 µg/mL
Note: Isolates No. 1, 2 and 10 have not grown; hence oxacillin MIC was recorded as ≤4 µg/mL; For all other isolates the MIC values have been recorded as ≥ 8 µg/mL

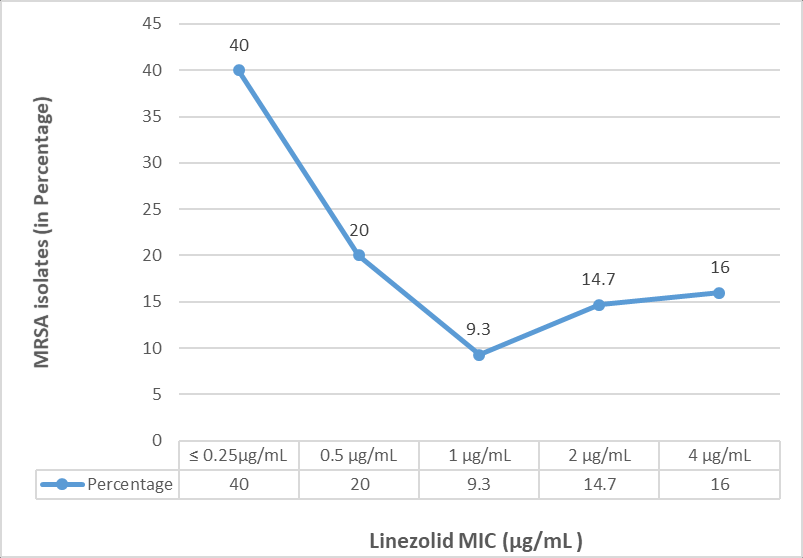
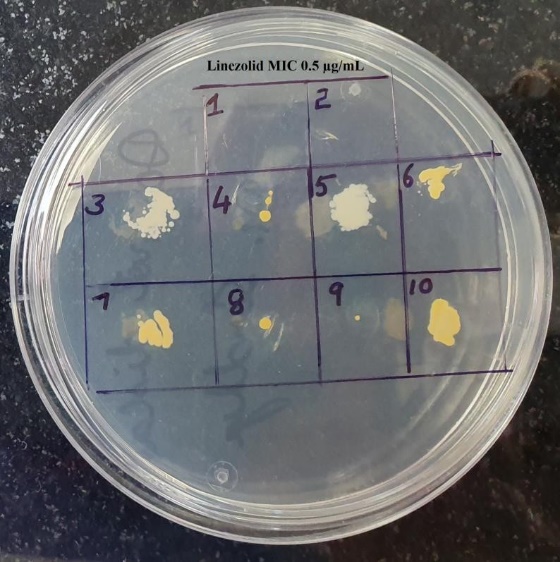
MIC values for linezolid by agar dilution method, ranged from ≤ 0.25µg/mL to 4μg/mL among 75 MRSA isolates. Thirty MRSA isolates (40%) had MIC of ≤ 0.25µg/mL, 15 (20%) had 0.5μg/mL, 7 (9.3%) had 1μg/mL, 12 (16%) isolates had high MIC value of 4μg/mL, and 6 (14.7%) had MIC of 2μg/mL. The distribution of linezolid MIC values (in µg/mL) among 75 MRSA isolates has been shown in Figure 5. Testing of linezolid MIC for Eight MRSA isolates at concentration of 0.5 µg/mL has been shown in Figure 6.
Figure 6
Testing of Linezolid MIC for Ten MRSA isolates at concentration of 0. 5µg/mL
Note: Isolates No. 1 and 2 have not grown; hence MIC has been recorded as ≤0.5 µg/mL; Linezolid MIC isolates 3 to 10 has been recorded as ≥ 1 µg/mL; Isolate no. 8 and 9 have a single colony with thin film of growth; which also to be taken as growth positive
The MIC50 for oxacillin was recorded as 8 µg/mL, where more than 50% of the isolates were inhibited and MIC90 was recorded as 16 µg/mL, where in 90% of the isolates were inhibited. The MIC50 for linezolid was recorded as 0.5 µg/mL, and MIC90 as 4 µg/mL.
MRSA isolates with linezolid MIC of ≤ 1µg/mL (69%) had oxacillin MICs ranged between 4 to 8 µg/mL. MRSA isolates (31%) with linezolid MIC of >1 µg/mL had oxacillin MICs ranged between 8 to ≥32 µg/mL. Comparison of distribution of oxacillin and linezolid MIC values among 75 MRSA isolates has been shown in Figure 7.
Figure 7
Scatter plot showing the distribution of oxacillin and linezolid MIC values among MRSA isolates (n=75)
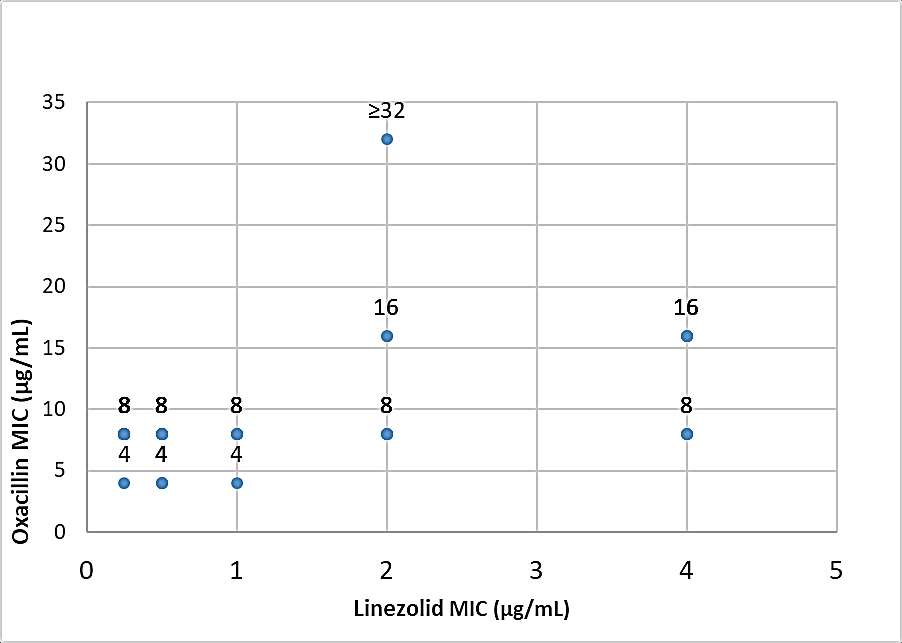
Pearson correlation coefficient (r) between oxacillin and linezolid MICs among 75 MRSA isolates, was 0.41, which indicates poor correlation between oxacillin MIC and linezolid MIC values among these tested MRSA isolates.
Discussion
Methicillin resistant Staphylococcus aureus (MRSA) is one of the leading cause of healthcare–associated infections. Last few decades, the prevalence of MRSA has been continuously increasing. MRSA prevalence varies between different countries; around 70% in Japan, 30% to 50% in the United States, 45% in the United Kingdom and in India 42.6%.1, 7, 11 The rate of MRSA isolation varies in different studies, which may be due to differences in the geographic location, study period, varied infection control practices followed across different hospitals. This may also depend on practice of antibiotic use.13
In this study, out of the 75 patients, majority (41%) were of 41-60 years and male gender was predominantly affected (61%). Various studies have reported that MRSA presents a major problem for older male patients; which again may be due to lowered immunity, frequent hospitalization and associated co-morbidities.14, 15
In the present study majority of the MRSA isolates (40%) were from skin and soft tissue infections (SSTIs), followed by foot ulcer (27%), sepsis (16%), osteoarthritis (10%) and chronic suppurative otitis media (7%). A study conducted by Indian Network for Surveillance of Antimicrobial Resistance (INSAR) group, have also found the commonest isolation of MRSA from SSTIs followed by catheter related blood stream infections (CRBSIs, 17%), and rest from bronchial washings, endotracheal secretions and sputum.1 However, a high prevalence of MRSA from blood culture specimen (35%) was observed in another study from Delhi.16
Methicillin resistance in S. aureus is coded by mecA gene, which encodes an altered penicillin binding protein 2a, which has reduced affinity for β- lactams, thereby provides resistance to all β-lactam antibiotics. In the current study, six MRSA isolates were not detected by oxacillin screen agar test; as their oxacillin MIC was below 6μg/mL; whereas all 75 MRSA isolates were detected by cefoxitin disk screening test. Similar observations were made by other researchers.1, 17, 18 This could be explained by the fact that, cefoxitin is a better inducer of mec A gene for expression of PBP2a as compared to oxacillin.1, 18, 19
In this study, MIC values for oxacillin obtained ranged from 4 μg/mL to >32μg/mL among MRSA isolates. Majority of the isolates (77.3%) had MIC of 8μg/mL, followed by 9.3% had MIC of 16 μg/mL, 8% had MIC of 4 μg/mL and 2.7% of the isolates each had MIC of 32μg/mL and >32μg/mL. Similar observations were done in other studies.17, 20
Vancomycin has been recommended for serious MRSA infections; whereas linezolid and daptomycin has been recommended for skin and soft tissue infections. Recent studies have reported reduced efficacy of vancomycin against MRSA infections, and subtle changes in the MIC may lead to clinical failure. Hence alternate anti-MRSA agents must be considered for treatment. Linezolid has been also used in severe infections due to its good antibacterial activity against gram-positive bacteria with a favourable short-term safety regimen. Reports of resistance to linezolid is less than for vancomycin resistance among Staphylococcus aureus; however, only limited data are available.5, 21, 22
In the current study, MIC values for linezolid, ranged from ≤ 0.25µg/mL to 4 µg/mL among MRSA isolates; Majority of the isolates (40%) had MIC of ≤ 0.25µg/mL and 16% had high MIC value of 4μg/mL. All the isolates were uniformly susceptible to linezolid. Similar observations were reported by Thool VU et al., and Shariq et al., from India.22, 23 However, in another study by Iguchi et al., in 2016 from Japan, reported higher MIC range for linezolid of 2 to 32 μg/mL.6 The clinical occurrence of linezolid resistance is rare, and has been documented to occur only following prolonged treatment for two weeks. There are reports of three-fold increase in the MIC from 4 μg/mL to 32 μg/mL following prolonged linezolid treatment.6 In another study by Garcia MS et al., among 12 patients admitted in ICU, linezolid resistant S.aureus (LRSA) infection has been reported and all these patients were on treatment with linezolid for short term prior to the isolation of LRSA.24
The MIC50 for oxacillin among MRSA isolates was 8 µg/mL, and MIC90 was recorded as 16 µg/mL, whereas, The MIC50 for linezolid was 0.5 µg/mL, and MIC90 was 4 µg/mL. Miyazaki M et al., also observed the same MIC values for tested MRSA isolates; but MIC 50 was 1µg/mL and MIC90 was 2µg/mL.25 Among these MRSA isolates, 69% of the isolates had linezolid MIC of ≤ 1 µg/mL and oxacillin MICs of 4 to 8 µg/mL. Only 31% of the isolates had higher linezolid MIC of 2 to 4 µg/mL and oxacillin MICs of 8 to 32 µg/mL. Pearson correlation coefficient, r was 0.41, between oxacillin MICs and linezolid MICs, which indicated poor correlation. Steinkraus G et al., also documented weak association between oxacillin MIC and linezolid MICs of MRSA isolates.26 The association between oxacillin MICs and MICs of other anti-MRSA agents although weak, were demonstrated. Thus, MRSA strains with high MICs to one agent may also select higher MICs to other anti-MRSA agents.16, 27
Although we observed significant changes in the linezolid MIC values among MRSA isolates, but all were uniformly susceptible to linezolid. There has been increased use of linezolid for MRSA SSTIs in our hospital in the last few years, suggesting that selection pressure may be responsible for the observed MIC creep for linezolid. Analysis of other susceptibility markers, such as MIC50 and MIC90, were useful in demonstrating minor changes in the MIC values. These minor MIC changes might lead to the decline in clinical response. One should be vigilant to monitor the clinical response indirectly by regular MIC testing, to avoid therapeutic failure.
Conclusion
Although, we did not observe any resistance to linezolid among the MRSA isolates, we should monitor carefully the antibiotic selection pressure and creeping MIC, to aid in early detection of emergence of resistance. This study highlights the restricted use of linezolid only for MRSA isolates and not for methicillin susceptible Staphylococcus aureus isolates. One should also explore the alternate therapeutic options such as macrolides and clindamycin for less severe MRSA infections, preserving linezolid and vancomycin for life threatening severe infections. Continuous monitoring of the MIC shifts even in the susceptible range may facilitate the early recognition of emergence of resistant isolates. This study highlights the fact that MRSA infections need to be controlled rather than treating, as there is always threat of development of resistance. There is need to encourage and enable adherence to recommended infection control practices, and ensure strong antibiotic stewardship practices by the health care professionals.

